EAS Security
 EAS Gate
 Security Tag
 EAS Accessories
 Gadgets
 Convex Mirror
 Road Barrier
 Burglar Alarm
 Calling System
Comparing Attendance Across Departments: An eHajira Guide
November 14, 2026
Comparing Attendance Across Departments: An eHajira Guide
A department with more absence records is not automatically performing worse than another department. It may have more employees, a different shift arrangement, or more scheduled working days within the selected period. Similarly, a department with fewer late arrivals may still account for a substantial number of late minutes.
These distinctions matter when HR teams compare attendance across departments. A summary report can identify patterns quickly, but the meaning of those patterns depends on how the numbers are defined and which records are included.
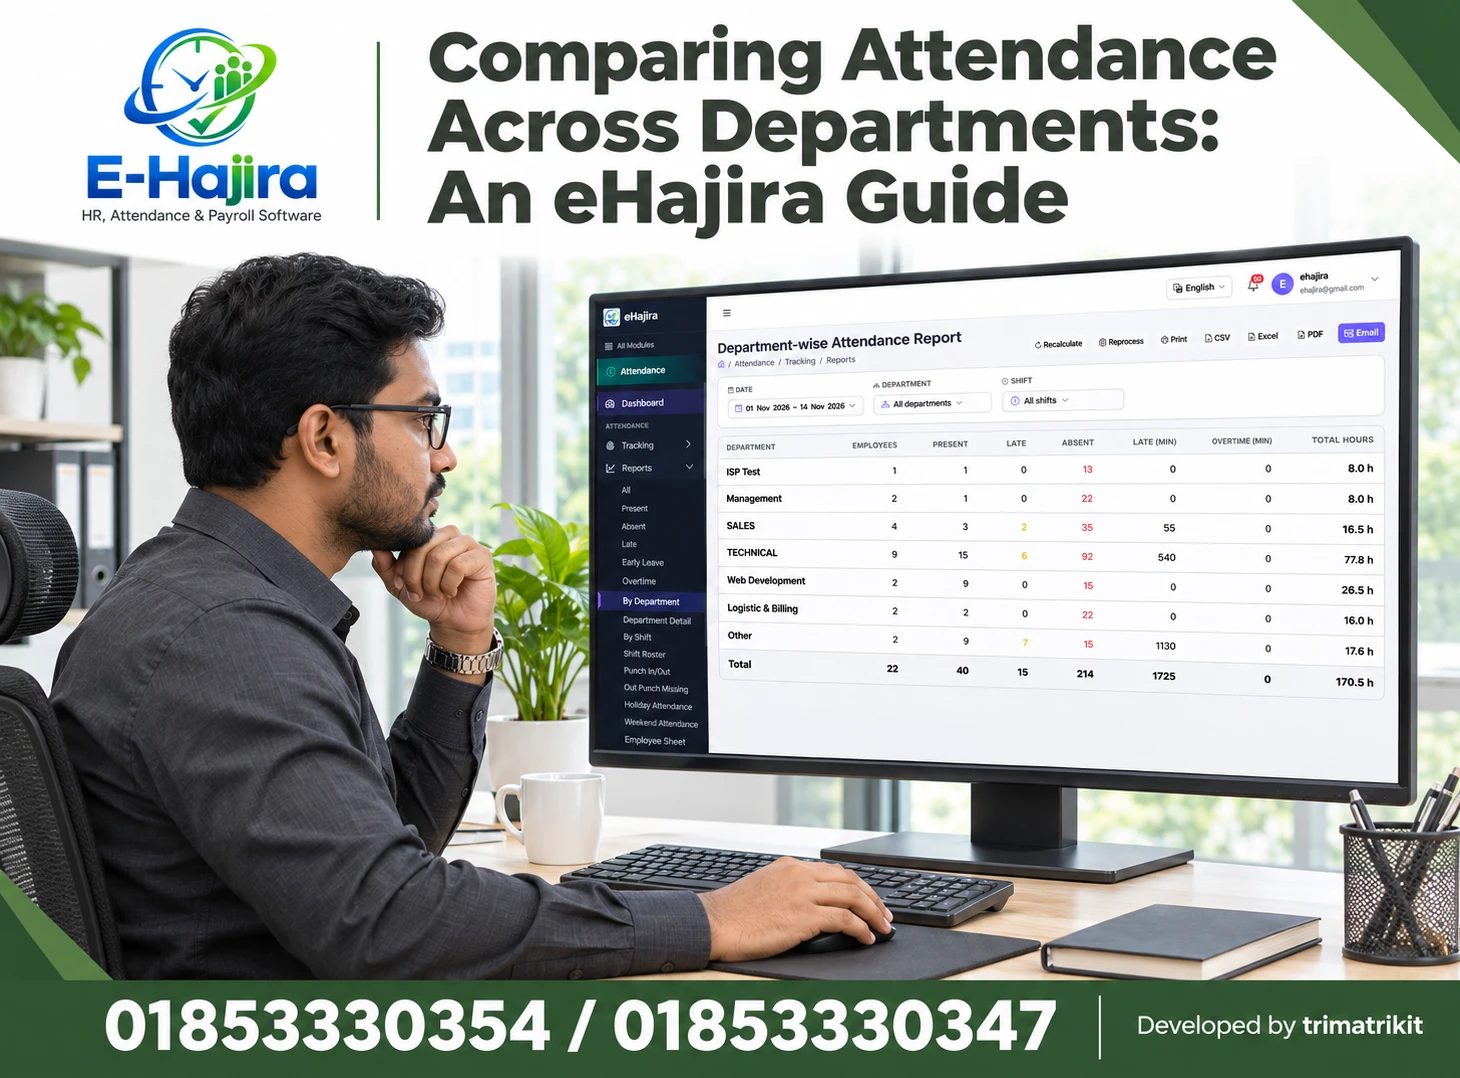
The eHajira Department-wise Attendance Report brings employee counts, attendance totals, late minutes, overtime minutes, and total hours into one departmental view. Used carefully, it can help administrators decide where further investigation is needed and prepare more useful discussions with department managers.
For businesses in Bangladesh, this approach is relevant to offices, technical service providers, sales organizations, educational institutions, and other workplaces with different departmental responsibilities. This guide explains how to interpret the supplied eHajira report, compare departments fairly, and move from summary figures to verified attendance information.
What the eHajira Department-wise Attendance Report Shows
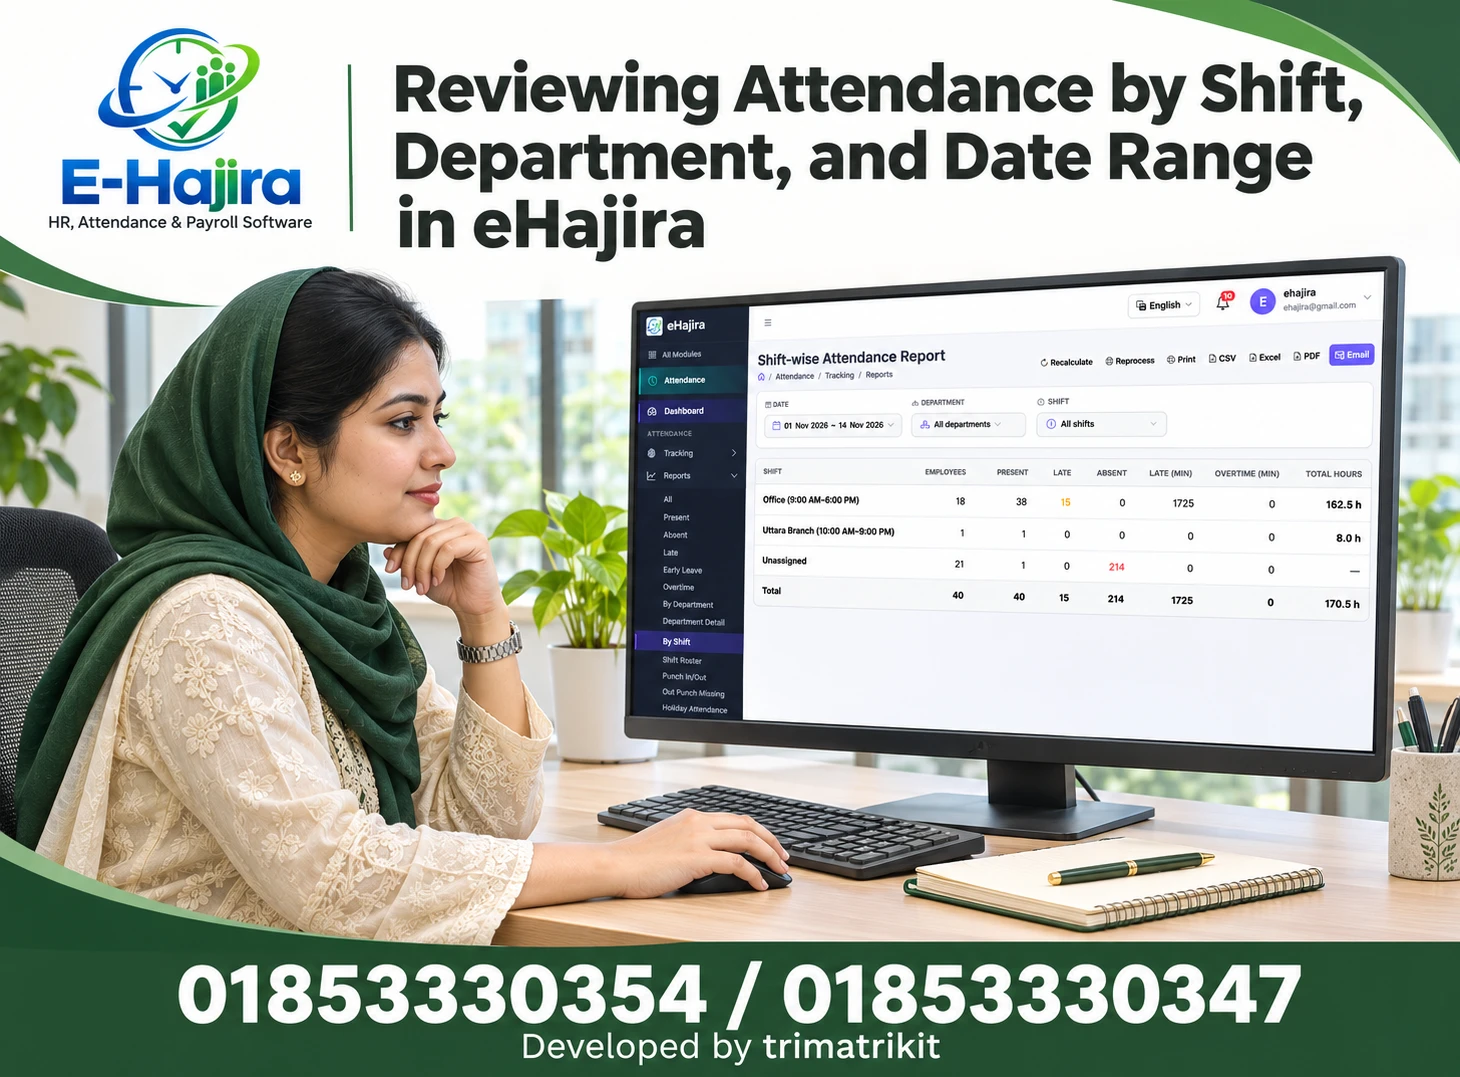
The supplied screen displays a Department-wise Attendance Report under Attendance and Reports. Its filters include Date, Department, and Shift.
The table contains Department, Employees, Present, Late, Absent, Late (Min), Overtime (Min), and Total Hours. Each department occupies a separate row, followed by a Total row.
The selected date range is 1 November to 14 November 2026. The report includes departments such as Management, Sales, Technical, Web Development, and Logistic & Billing.
This structure supports a departmental overview rather than an employee-by-employee explanation. It can show where attendance records accumulate, but it does not identify the reason behind each absence, the employee responsible for each late event, or the underlying calculation for every reported hour.
Research Context and the Limits of Product Claims
Published eHajira supplier information describes attendance management with department-wise grouping. That supports the general relevance of departmental attendance analysis within the product offering. However, the supplied screen remains the direct reference for the columns and controls discussed in this guide. A commercial product description does not establish the precise calculation rules or enabled features in every installation.
Working-time definitions also require care. ILOSTAT distinguishes concepts such as hours actually worked, hours paid for, and normal working hours. These distinctions reinforce the need to understand what a time-based report measures before using it for another purpose. They do not define eHajira’s specific Total Hours calculation.
The practical guidance below combines the visible interface with transparent examples. It does not claim that the demonstration figures represent national attendance patterns or industry benchmarks in Bangladesh.
Why Department Comparisons Matter in Bangladesh
Different departments can have different attendance arrangements even within the same organization. Administrative employees may follow fixed office hours, while technical staff may work assigned shifts or attend external service calls. Sales employees may also have approved responsibilities outside the office.
A department-level report helps HR identify where these arrangements need closer review. For example, an unusual increase in absence records might lead to a discussion about shift assignments, approved leave, or missing attendance information.
The report can also support coordination between central HR and department managers. Instead of discussing attendance through scattered messages, both teams can refer to the same selected period and departmental totals.
The benefit comes from asking better questions. The summary should guide investigation rather than become an automatic ranking of employee commitment or department performance.
Start by Defining the Comparison Question
Before reading the numbers, decide what the comparison is intended to answer.
A question about punctuality requires attention to late events and late minutes. A question about attendance coverage requires verified scheduled work opportunities and relevant attendance classifications. A question about recorded hours requires an understanding of the hour calculation and the applicable schedules.
These questions are related, but they are not interchangeable. A department may have frequent short delays while another has fewer, longer delays. A department may also record substantial hours without those hours measuring the quality of completed work.
A clear question prevents the analysis from shifting between unrelated metrics. It also helps managers understand why a particular department has been selected for further review.
Confirm the Date Range Before Comparing Departments
The supplied report covers a two-week calendar range. Its attendance totals therefore need to be interpreted across that period rather than as a single day’s headcount.
When comparing departments within one report, confirm that all rows use the intended period. When comparing different reports, keep the periods reasonably comparable.
A full month should not be compared directly with a partial month without explaining the difference. Similarly, calendar periods containing different working arrangements can produce different totals even when employee behavior has not changed.
Record the exact date range when preparing a management summary. A statement such as “Technical had more absence records” is incomplete without the reporting period and the relevant context.
Understand the Employees Column Separately
The Employees column shows the employee count reported for each department. In the supplied example, Technical displays nine employees, Sales four, and Management two.
These counts provide useful context, but the screenshot does not explain exactly how the software determines membership for the selected period. It does not establish whether the count follows current assignments, historical assignments, or another inclusion rule.
That uncertainty matters when employees join, leave, transfer departments, or become inactive during the period.
Before using Employees as the denominator in a formal metric, confirm its definition. A displayed count can help explain department size without necessarily representing every employee’s eligible working days throughout the entire date range.
Why Present Can Exceed the Employee Count
Technical displays nine employees and fifteen Present entries. This immediately shows why the Present column should not be interpreted as fifteen different people.
Across a multi-day report, one employee can contribute attendance information on several dates. The displayed number is an aggregate attendance count whose exact inclusion rules should be confirmed.
The same distinction applies to the report total. Twenty-two employees and forty Present entries do not mean that forty individuals attended a workplace with twenty-two employees.
When communicating the figures, use wording such as “reported Present count for the selected period” until the underlying definition is established. Avoid describing the total as a unique employee headcount.
Do Not Add Attendance Columns Without Checking Their Relationship
Present, Late, and Absent appear beside one another, but that does not prove that every column represents a mutually exclusive category.
A late arrival may also count as attendance, depending on the report’s rules. If so, adding Present and Late would count some attendance information twice.
The department summary alone does not establish the classification logic. Check detailed records or the documented behavior before calculating totals from these columns.
This is especially important when preparing percentages. A formula may produce a neat-looking result while using overlapping categories. The calculation is only meaningful when the numerator and denominator represent clearly defined, compatible information.
Read Late Counts and Late Minutes Together
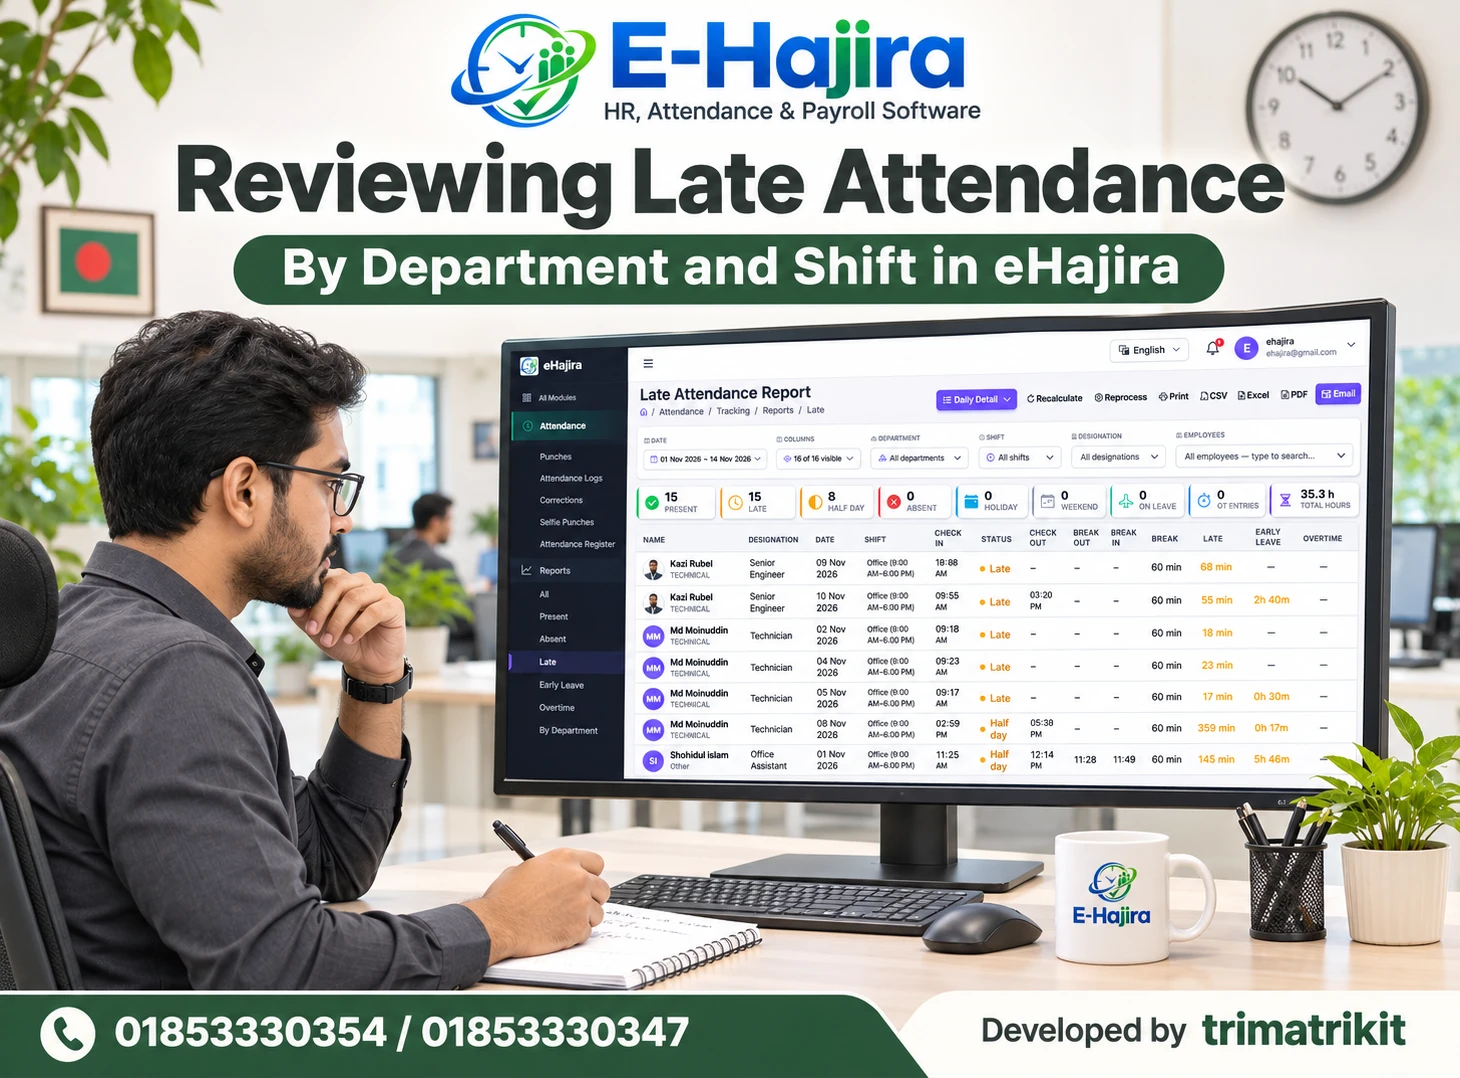
The supplied report separates Late from Late (Min). That distinction allows HR to consider frequency and duration independently.
Sales displays two in the Late column and fifty-five late minutes. Technical displays six and five hundred forty minutes. Other displays seven and one thousand one hundred thirty minutes.
The figures suggest different patterns requiring investigation. However, they do not identify whether the events involve several employees or repeated records for one employee.
A department with more late events may not have the longest average delay. Likewise, a department with fewer events can still account for considerable lost scheduled time. Reading both columns provides a better starting point than relying on either one alone.
Calculate Averages Only After Verifying Definitions
If the Late count represents late events and Late (Min) totals the minutes attached to those same events, dividing minutes by events can produce an average delay per event.
Using that explicitly conditional interpretation, Technical’s five hundred forty minutes divided by six gives ninety minutes per event. Sales’ fifty-five minutes divided by two gives twenty-seven and a half minutes per event.
These are calculations from the displayed example, not additional built-in metrics confirmed by the screenshot.
Before reporting such averages, verify that the two columns cover the same records. Also explain that an average can hide variation: several short delays and one very long delay may produce a result that describes none of the individual events particularly well.
Why Absence Totals Need Further Investigation
Technical shows ninety-two in the Absent column, while Sales shows thirty-five. Those raw totals cannot establish which department has the greater absence rate.
Technical has more employees in the displayed report. Its scheduled work opportunities may also differ because of shifts, joining dates, or other arrangements.
An Absent classification also does not provide a complete explanation of the underlying event. Relevant questions include whether the schedule was correct, whether approved leave was reflected appropriately, and whether required attendance information had been processed.
The department summary is useful for locating a pattern. Employee-level records and supporting information are needed to understand that pattern before taking action.
Use Scheduled Work Opportunities for Fairer Comparisons
A fair attendance rate requires an appropriate denominator. For a multi-day period, employee count alone is usually insufficient.
Consider a hypothetical department with five employees, each scheduled for ten days. That creates fifty scheduled employee-days, assuming there are no relevant variations. Another department with ten employees on the same schedule creates one hundred.
Five verified absence days would represent different proportions in those two departments. This illustrates why raw absence totals can mislead.
In real analysis, account for actual schedules, joining and leaving dates, holidays, and other applicable exclusions. The supplied report does not display a scheduled employee-day denominator, so a defensible rate may require additional verified information.
Compare Similar Shifts Where Possible
The Shift filter helps narrow the report to a selected working arrangement. This can make departmental comparisons more meaningful when teams operate under different schedules.
For example, comparing office-shift employees across departments may answer a different question from comparing all employees regardless of shift.
Confirm what the selected shift includes and whether employees had that assignment on the relevant dates. An incorrect assignment can affect attendance interpretation even when the report filter is working as designed.
A filtered comparison should be described accurately. Findings from one shift should not automatically be presented as conclusions about the whole department or organization.
Interpret Total Hours Cautiously
The supplied total row displays 170.5 hours. Individual department totals include 77.8 hours for Technical and 26.5 hours for Web Development.
These figures show the Total Hours values produced by the report. They do not, by themselves, establish paid hours, scheduled hours, or measured business output.
The screenshot also does not explain how breaks, incomplete punches, overnight shifts, or other adjustments contribute to the calculation.
Understand the underlying definition before comparing the values. A larger department may naturally generate more recorded hours, while a smaller department may have a higher average per eligible workday. Neither observation directly establishes productivity or the quality of completed work.
Recognize Decimal Hours
Values such as 16.5 h and 77.8 h use decimal notation. They should not be read as hours followed by minutes.
For example, if a value is expressed in decimal hours, 16.5 hours equals sixteen hours and thirty minutes. The decimal fraction represents part of an hour.
Displayed rounding can affect comparisons with detailed records. A rounded summary may not reproduce every minute shown elsewhere, particularly when several records are aggregated.
When precise reconciliation is necessary, confirm the software’s rounding and export behavior. Avoid interpreting a small difference as a missing record before checking whether the reports display different levels of precision.
What Zero Overtime Does and Does Not Mean
Every displayed department shows zero in Overtime (Min). This establishes that the report is displaying zero overtime minutes for the selected scope.
It does not independently prove that nobody remained at work beyond a scheduled time. Overtime calculation may depend on applicable rules, recognized records, or authorization arrangements that are not shown here.
Nor does zero overtime demonstrate that workload was balanced or that staffing levels were ideal.
If overtime is the focus of the review, compare the relevant detailed information and confirm how the installation calculates it. Treat the departmental value as a report result requiring a known definition.
Review Transfers, Joiners, and Leavers
Department comparisons become more complex when employee membership changes during the reporting period.
A person transferred halfway through a month may have attendance associated with different departmental contexts. A new joiner may have fewer scheduled days than an employee who worked throughout the period.
The screenshot does not establish how these cases are allocated. Verify the report behavior before interpreting an apparent change in departmental performance.
For trend analysis, explain material staffing changes alongside the figures. Otherwise, an increase caused by a larger team could be mistaken for worsening attendance, while a decrease caused by departures could be mistaken for improvement.
Move from Department Summary to Employee Detail
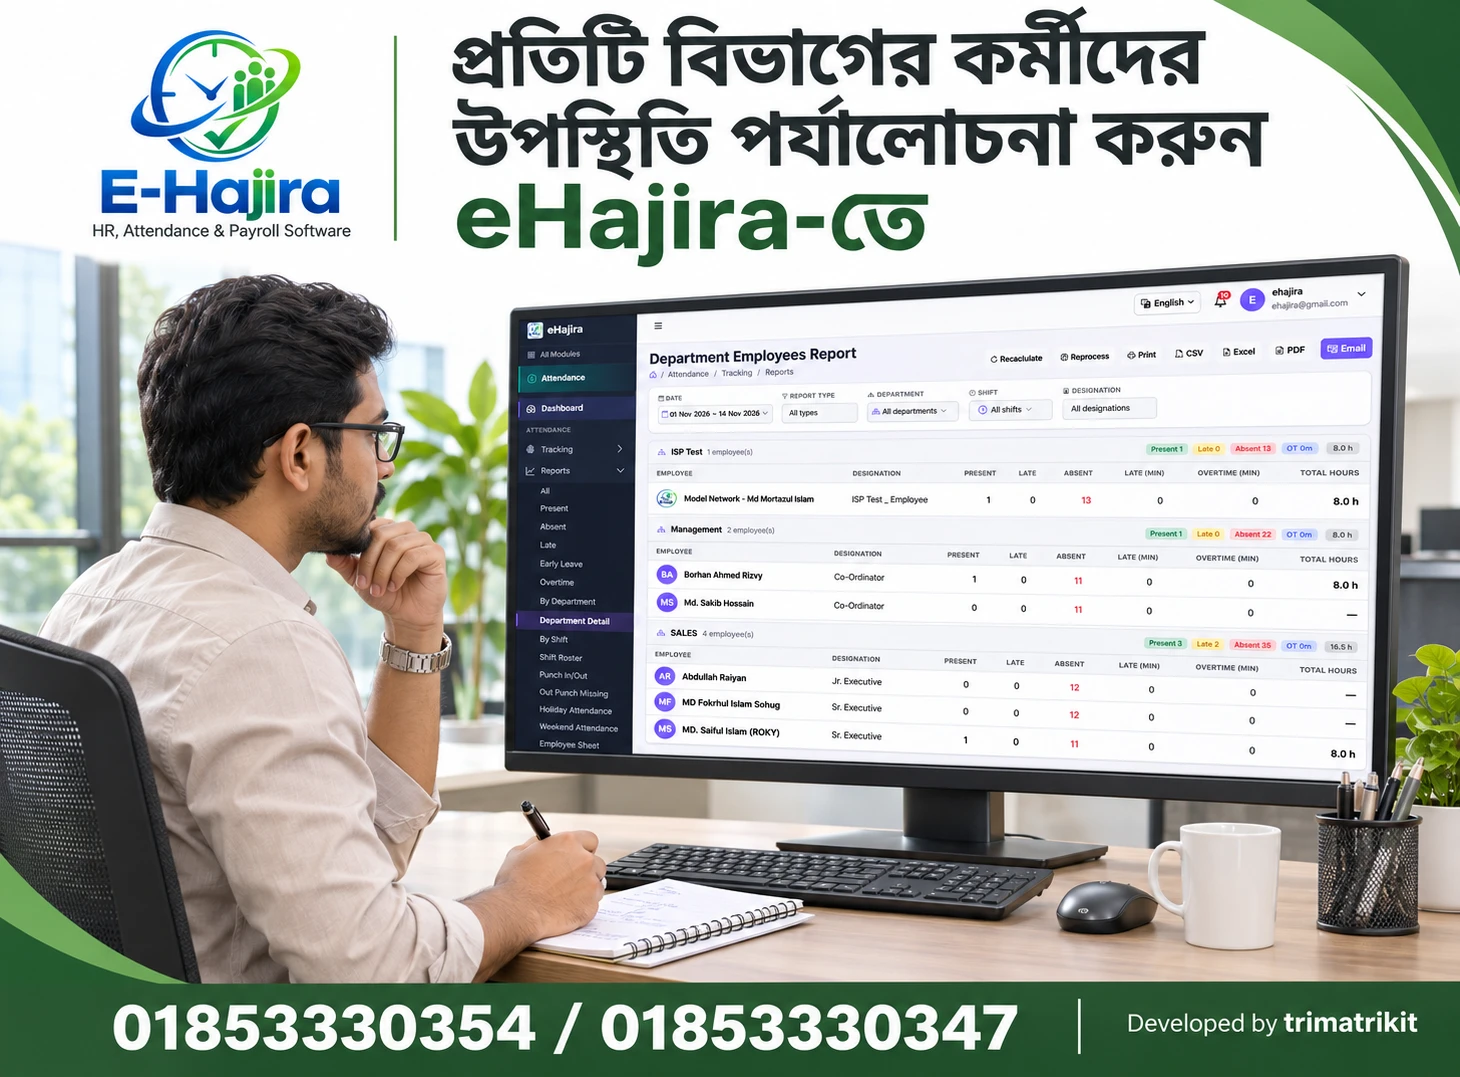
The navigation includes Department Detail, along with other attendance report pages. These provide relevant places to investigate further, although the supplied screenshot does not show their full content or establish clickable drill-down behavior from summary rows.
When a departmental total needs explanation, identify the employees and dates contributing to it through the available detailed reports.
Compare the same period and relevant filters. Then inspect the underlying attendance information and any applicable approvals or corrections.
A useful management statement connects the summary to verified findings. It explains whether the pattern reflects confirmed attendance events, configuration issues, incomplete information, or a combination of causes.
Investigate Data Quality Before Drawing Conclusions
Unexpected department totals can arise from issues that require administrative review.
An incorrect employee-to-department assignment can place records in an unexpected row. An inappropriate shift can affect attendance classification. Missing or delayed attendance information can also require investigation.
These are possible causes, not conclusions about the supplied demonstration report.
Begin with a specific discrepancy and trace it to relevant records. Avoid changing multiple settings at once without understanding their relationship to the issue. A focused approach makes it easier to determine why the report changed and whether the correction addressed the original problem.
Use Recalculate and Reprocess with an Understood Purpose
The screen includes separate Recalculate and Reprocess controls. Their presence does not explain their full scope or make them interchangeable.
Confirm which records each action affects, what information it uses, and whether any existing adjustments require special consideration.
If a correction has been made, preserve enough context to compare the previous and resulting figures. This helps distinguish an expected change from an unexplained difference.
Repeated processing is not a substitute for identifying the cause of a discrepancy. Use these controls according to the actual installation’s guidance and review the results afterward.
Prepare Management Reports with the Right Context
The page offers Print, CSV, Excel, PDF, and Email controls. Before distributing an output, confirm that it represents the intended dates, departments, and shifts.
Check the output itself rather than assuming it reproduces every detail exactly as displayed. Verify headings, totals, units, and any relevant precision.
A management explanation should distinguish observations from conclusions. “Technical has the highest displayed absence total” is an observation. “Technical has the worst attendance” requires comparable rates, verified definitions, and supporting context.
Distribute employee details only where needed for the recipient’s responsibility. Department summaries may be sufficient for some discussions, while investigation requires more specific information.
A Practical Comparison Example
Imagine a fictional Bangladeshi service company comparing its Sales and Technical departments over one month.
Technical has more absence records, but it also has more employees and more scheduled employee-days. Sales has fewer absence records, yet its verified absence proportion may still require attention after appropriate denominators are applied.
During investigation, HR also finds several Technical records affected by an incorrect shift assignment. Separately, some Sales late events require discussion with the department manager.
The department summary helped locate the questions. The final explanation emerged from schedules, detailed records, and confirmed context. This is a more useful outcome than ranking departments by the largest raw number.
Frequently Asked Questions
1. What is the eHajira Department-wise Attendance Report?
It is a departmental summary showing employee counts, attendance figures, late minutes, overtime minutes, and total hours. The supplied screen includes date, department, and shift filters.
2. Why compare attendance across departments?
Comparison can help HR identify patterns requiring investigation, coordinate with managers, and review attendance arrangements. Its purpose should be clearly defined before choosing the metrics.
3. Does a larger absence total mean worse attendance?
Not necessarily. Department size and scheduled work opportunities affect totals. A meaningful comparison requires verified definitions and an appropriate denominator.
4. Why can Present exceed Employees?
The selected period covers multiple days, allowing repeated attendance contributions from the same employee. The Present total should not automatically be interpreted as a unique headcount.
5. Can Present and Late be added together?
Only if the report’s definitions establish that they are separate categories. If late attendance is also included in Present, adding them would double-count some information.
6. What is the difference between Late and Late (Min)?
They distinguish the reported late count from the reported duration in minutes. Confirm the exact counting rules before calculating averages or percentages.
7. Can average late duration be calculated?
Yes, if the count and minute total refer to the same defined events. Label the result as a separate calculation and explain that averages can hide variation.
8. Is Employees a valid denominator for an absence rate?
Employee count alone does not account for a multi-day schedule. Verified scheduled employee-days are generally more suitable for a day-based comparison.
9. Does Absent explain why someone was away?
No. A summary classification does not establish the complete reason. Review detailed attendance information, relevant schedules, and applicable approvals.
10. Why use the Shift filter?
It can help compare employees working under similar schedules. Confirm the selected shift’s scope and relevant assignments before interpreting the results.
11. Does the report provide a Branch filter?
The supplied filter area shows Date, Department, and Shift. A separate Branch filter is not demonstrated on this screen.
12. Does Total Hours mean payable hours?
That cannot be concluded from the screenshot. Confirm the calculation and payroll relationship before using the value for financial decisions.
13. Does a higher Total Hours value mean better productivity?
No. Recorded time is not a direct measure of output quality, service results, or business performance.
14. Is 16.5 hours the same as sixteen hours and five minutes?
No. In decimal-hour notation, 16.5 hours equals sixteen hours and thirty minutes. Confirm the displayed unit when interpreting values.
15. Does zero overtime prove nobody worked beyond schedule?
No. It means the report displays zero calculated overtime minutes for the selected scope. The underlying rules and records require confirmation.
16. Can transfers affect department comparisons?
Yes. Changes in departmental membership can complicate interpretation. Confirm how the report allocates attendance when employees transfer during the selected period.
17. Should new joiners be treated like full-period employees?
Their actual eligible schedules should be considered. A person joining midway through a period has different work opportunities from someone scheduled throughout it.
18. Where should unusual totals be investigated?
Use relevant detailed attendance reports and source information. Department Detail appears in the navigation, but its exact behavior should be checked in the installation.
19. Are Recalculate and Reprocess the same?
They are separate controls on the screen. Confirm their purposes, scope, and effects before using them.
20. Can this summary directly determine salary deductions?
The summary alone is insufficient for a specific financial decision. Verify attendance information and follow the institution’s applicable review process.
21. What should be checked before exporting?
Verify the period, department, shift, units, totals, and output scope. Review the exported file to confirm it contains the intended information.
22. How often should departments be compared?
Choose a regular review period suited to operational needs. Keep comparison definitions consistent and explain staffing or scheduling changes that affect trends.
Make Department Comparisons Useful for Decisions
The eHajira Department-wise Attendance Report provides a practical overview of attendance across teams. Its value increases when employee counts, attendance totals, durations, and hours are interpreted according to their distinct meanings.
Use comparable periods, understand the schedules, and investigate significant differences through detailed records. This gives managers a clearer basis for discussing attendance and addressing the causes behind unusual figures.
For assistance with eHajira attendance reporting and departmental review, contact 01853330354 or 01853330347.
Recent Post